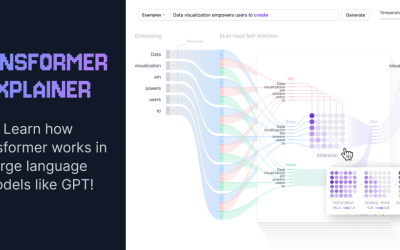
An interactive visualization tool showing you how transformer models work in large language models (LLM) like GPT. Transformer is a neural network architecture that has fundamentally changed the approach to Artificial Intelligence. Transformer demonstrating its versatility across numerous domains.
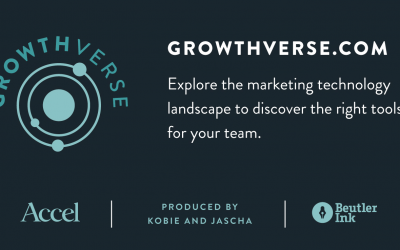
An interactive visualization of the marketing universe. With input from over 100 CMOs Growthverse represents a taxonomy of the marketing technology ecosystem.
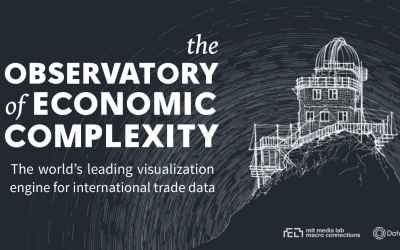
The Observatory of Economic Complexity is a tool that allows users to quickly compose a visual narrative about countries and the products they exchange. It was Alexander Simoes' Master Thesis in Media Arts and Sciences at the MIT Media Lab.
See current wind, weather, ocean, and pollution conditions, as forecast by supercomputers, on an interactive animated map. Updated every three hours.
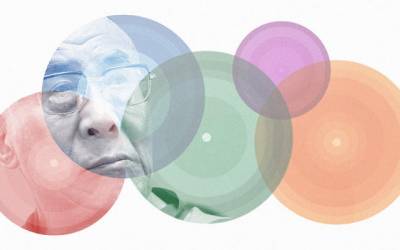
When the Dalai Lama teams up with a top psychologist, who teams up a top data viz firm, you get the Atlas of Emotions.
Sign Up now to share your Curiosity